Wondering if now is the right time to buy or sell in Grand Junction’s 81501? You are not alone. Headlines can be noisy, but the real story shows up in a few simple numbers. In this guide, you will learn how to read months of supply, days on market, and price per square foot so you can time your move and negotiate with confidence. Let’s dive in.
Inventory, DOM, and PPSF basics
Inventory or months of supply
Months of supply answers a simple question: if no new homes came on the market today, how long would it take to sell everything that is listed at the current sales pace? You calculate it by dividing active listings by the average monthly closed sales. Low months of supply, roughly under 3, points to a seller-favorable market. High months of supply, roughly over 6, leans buyer-favorable. A balanced range is often 4 to 6 months. Use a 3 to 6 month rolling average for closed sales to smooth out short-term spikes.
Days on market (DOM)
DOM is the number of days from the listing date to the contract date. Some MLS systems reset DOM when a listing is relisted, while others use cumulative DOM. The key is to compare DOM to local 81501 trends and similar nearby neighborhoods. Short DOM signals quick demand and a chance of multiple offers. Longer DOM often points to lower demand or property-specific issues.
Price per square foot (PPSF)
PPSF is the sale price divided by the finished living area. It is most reliable when you compare similar homes by type, age band, condition, and location. Small homes and high-end homes can distort this number, so pair PPSF with the actual price and clear adjustments for condition and lot. Use median PPSF for 81501 sold listings over a recent time window as a baseline, then adjust for upgrades or deferred maintenance.
Other quick reads: sale-to-list and absorption
Sale-to-list ratio is the sale price divided by the list price. Above 100 percent signals buyers bidding over list, while below 100 percent shows downward negotiation. Absorption rate and the active-to-pending ratio offer additional demand context. A higher absorption rate or more pendings relative to actives points to stronger momentum.
Local context for 81501
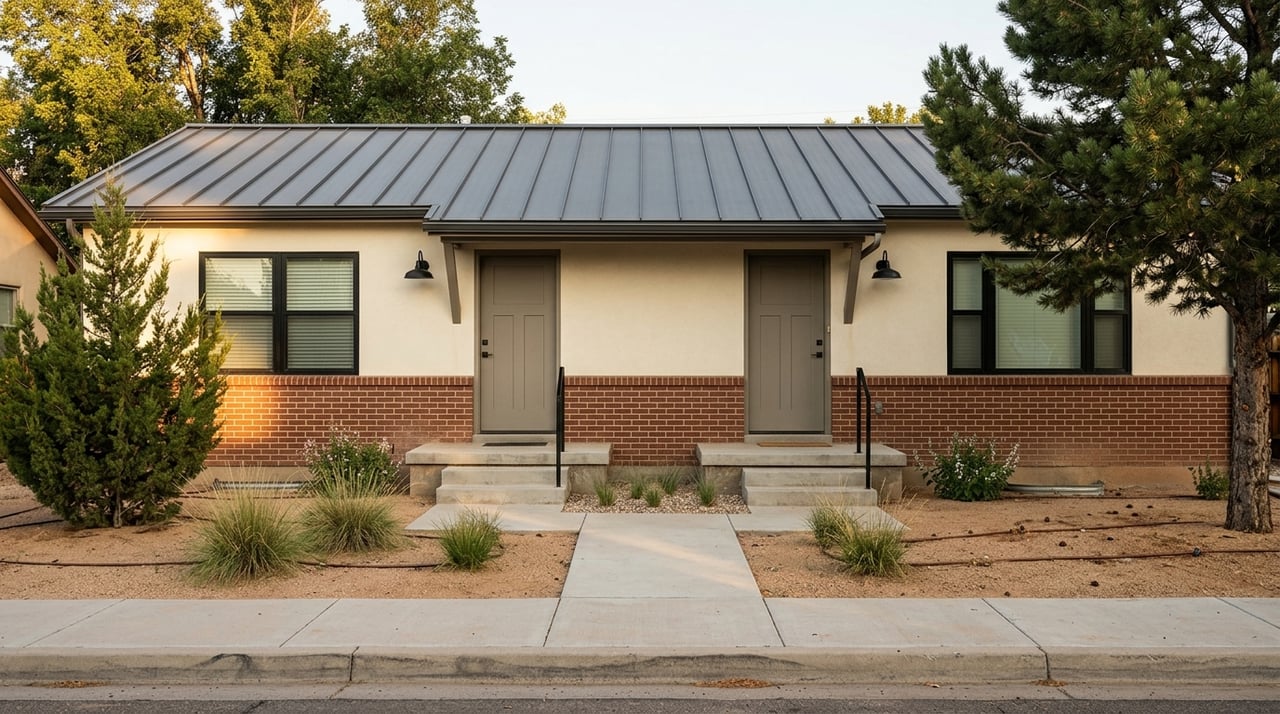
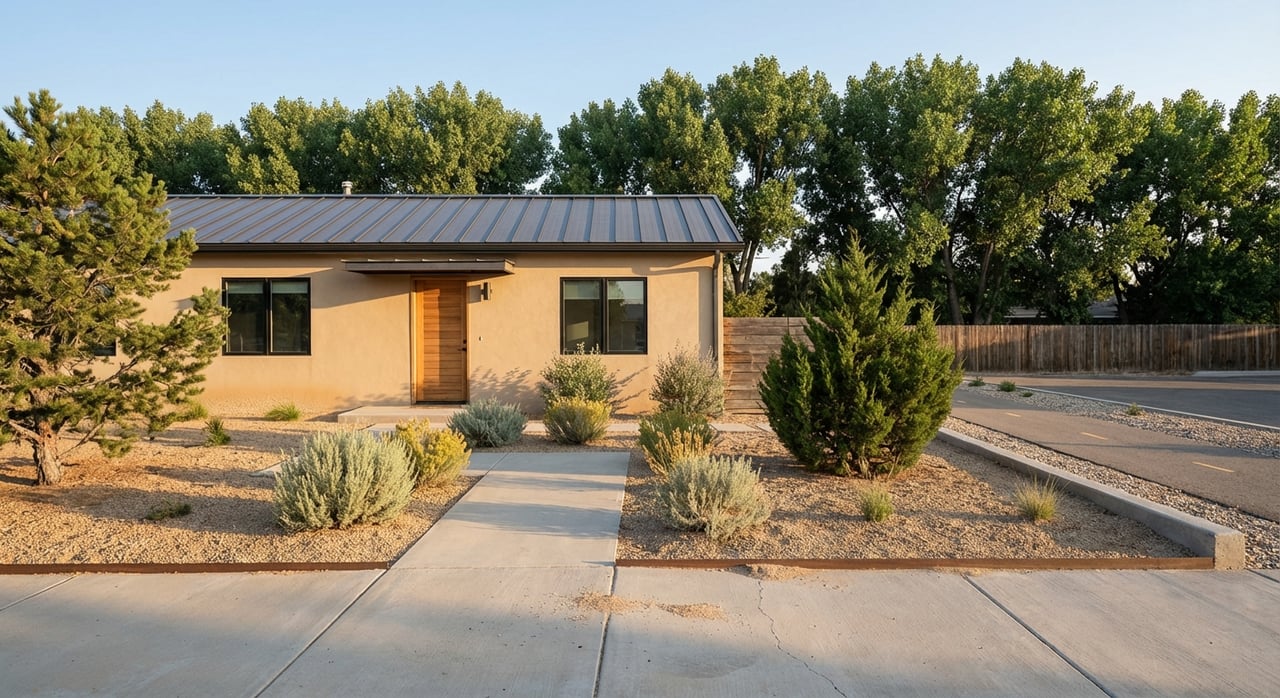
The 81501 ZIP covers a core section of Grand Junction. You will see a mix of older mid-century single-family homes, newer infill, and some condos or townhomes. PPSF and pricing shift by block, proximity to downtown amenities, and property condition. For clean comparisons, filter by property type, bedrooms, finished square feet, lot size range, and renovation status.
Pull a clean MLS snapshot
Use this simple process to build a clear 81501 read:
- Set filters: ZIP 81501; pick a property class (single-family or condo/townhome); typical 2 to 4 beds; finished square feet within about 20 percent of your target; and a time window of 90 days for a fast market or up to 6 months for a slower one.
- Collect solds: Pull 3 to 5 recent sold comps. Record list price, sale price, list-to-sale percentage, DOM, contract date, finished square feet, and PPSF. Note key features like remodels, garage count, or lot premiums.
- Collect actives: Pull current actives and note list price, asking PPSF, and current DOM. Compare them to the sold set.
- Include a price-reduced or expired listing: It shows negotiation dynamics and pricing risk.
- Compute the core metrics: Months of supply using actives divided by the average monthly closed sales from the last 3 months. Calculate median PPSF for solds and compare to actives.
- Timestamp your work: Note “MLS data current as of [date]” and keep screenshots or exports. Also note whether the MLS uses cumulative DOM or resets on relist.
What the numbers mean for you
Inventory and your timing
- Low inventory under roughly 3 months means sellers have leverage. As a buyer, expect faster decisions, tight contingencies, and possible escalation clauses. As a seller, you can price confidently and use strong marketing to attract multiple offers.
- Balanced inventory around 4 to 6 months supports reasonable negotiations for both sides. Buyers can use standard contingencies. Sellers should price in line with current comps and be prepared to negotiate.
- Higher inventory above roughly 6 months leans buyer-favorable. Buyers may negotiate below list, request concessions, and set longer timelines. Sellers may offer incentives or early price positioning to stand out.
DOM as a negotiation signal
- Short DOM relative to the local average suggests demand. Buyers should prepare best-and-final offers and focus on clean terms. Sellers may see fewer repair requests and stronger pricing.
- Rising DOM or repeated reductions suggests more flexibility. Buyers can time offers and request repairs. Sellers should consider the first price adjustment after 2 to 4 weeks if interest is low.
PPSF and your offer strategy
- Use PPSF to normalize size differences, but adjust for condition, lot, views, and parking. A full remodel or a large lot can justify a higher PPSF.
- If a home’s PPSF is well above the recent median for similar 81501 sales, that is a negotiating point unless upgrades explain the premium. If it is below, there may be built-in value, but verify that deferred maintenance or hidden costs are not the reason.
Sale-to-list and momentum checks
- A market where sale-to-list ratios run above 100 percent signals competition and limited flexibility. Averages below 100 percent indicate room to negotiate.
- Pair sale-to-list readings with an active-to-pending snapshot. More pendings relative to actives shows near-term demand strength.
Example calculations (illustrative)
These examples show the math process only. Replace the figures with your current MLS pull for 81501.
- Months of supply example (illustrative): If 81501 has 120 active listings and 90 closed sales in the last 3 months, the average monthly closed sales is 30. Months of supply equals 120 divided by 30, or 4 months. That reads as a balanced market in this example.
- PPSF comparison (illustrative): A sold comp at 1,400 square feet closes for 350,000. PPSF is 350,000 divided by 1,400, or 250 per square foot. An active listing at 1,500 square feet priced at 375,000 also shows 250 per square foot. If your subject is 1,600 square feet and unrenovated, you would adjust expectations below these upgraded comps.
Use MLS examples the right way
Show a compact snapshot rather than a long list. Pick three to five that are close to your subject in type, size, and age. Call out a few key numbers and one adjustment note on condition or lot.
- Listing A (Sold)
- Beds / Baths / Sq ft:
- List date / Contract date / DOM:
- List price / Sale price / Sale-to-list %:
- PPSF (sale):
- Key features and adjustments:
- Listing B (Active)
- Beds / Baths / Sq ft:
- List date / Current DOM:
- List price / Asking PPSF:
- Key features and adjustments:
- Listing C (Price reduced or expired)
- Beds / Baths / Sq ft:
- List date / DOM at reduction:
- Original list price / Current price:
- Key features and adjustments:
Label your set “MLS examples — sourced [date]” so readers know it is current. Avoid publishing full street addresses for private sellers if local policy limits that.
Common pitfalls to avoid
- Applying PPSF across very different neighborhoods or property classes. Keep it apples-to-apples.
- Relying on one listing’s DOM. Use trend comparisons for 81501 and check listing history.
- Ignoring condition, renovations, lot size, or views. These can shift value more than PPSF alone.
- Mixing detached homes with condos or townhomes in one comp set.
- Using old comps in a fast-moving stretch. Tighten the time window to 30 to 90 days when activity is high.
Ready to get specific?
If you want a clear read on your property or target price range in 81501, we can prepare a valuation-driven snapshot that covers months of supply, DOM trends, PPSF, and likely negotiation paths. You will get a practical plan that fits your timing and goals. Reach out to the GSD Broker Team to get started.
FAQs
Is days on market reliable in Grand Junction’s 81501?
- DOM is useful, but MLS reporting varies. Check listing history and whether the system uses cumulative DOM or resets on relist. Compare to local trends instead of judging one listing.
Can I use price per square foot across all of Grand Junction?
- Use PPSF with caution across neighborhoods. It is most reliable within the same property type, age band, and subarea, with adjustments for condition and lot.
How many comps should I review for 81501?
- Aim for 3 to 5 recent sold comps, plus 2 to 3 actives and one price-reduced or expired listing to understand negotiation patterns.
How recent should comps be in a changing market?
- In a fast-moving period, focus on the last 30 to 90 days. If activity is slower, widen the window up to 6 months and note any shifts.
How do interest rates affect inventory and DOM?
- Higher rates generally reduce purchasing power, which can increase months of supply and DOM. Falling rates can have the opposite effect by boosting demand and tightening supply.
Should a buyer waive inspections to win in 81501?
- Waiving inspections is not recommended for typical buyers. Inspections can uncover costly defects. If you shorten timelines, do so with care and professional guidance.